
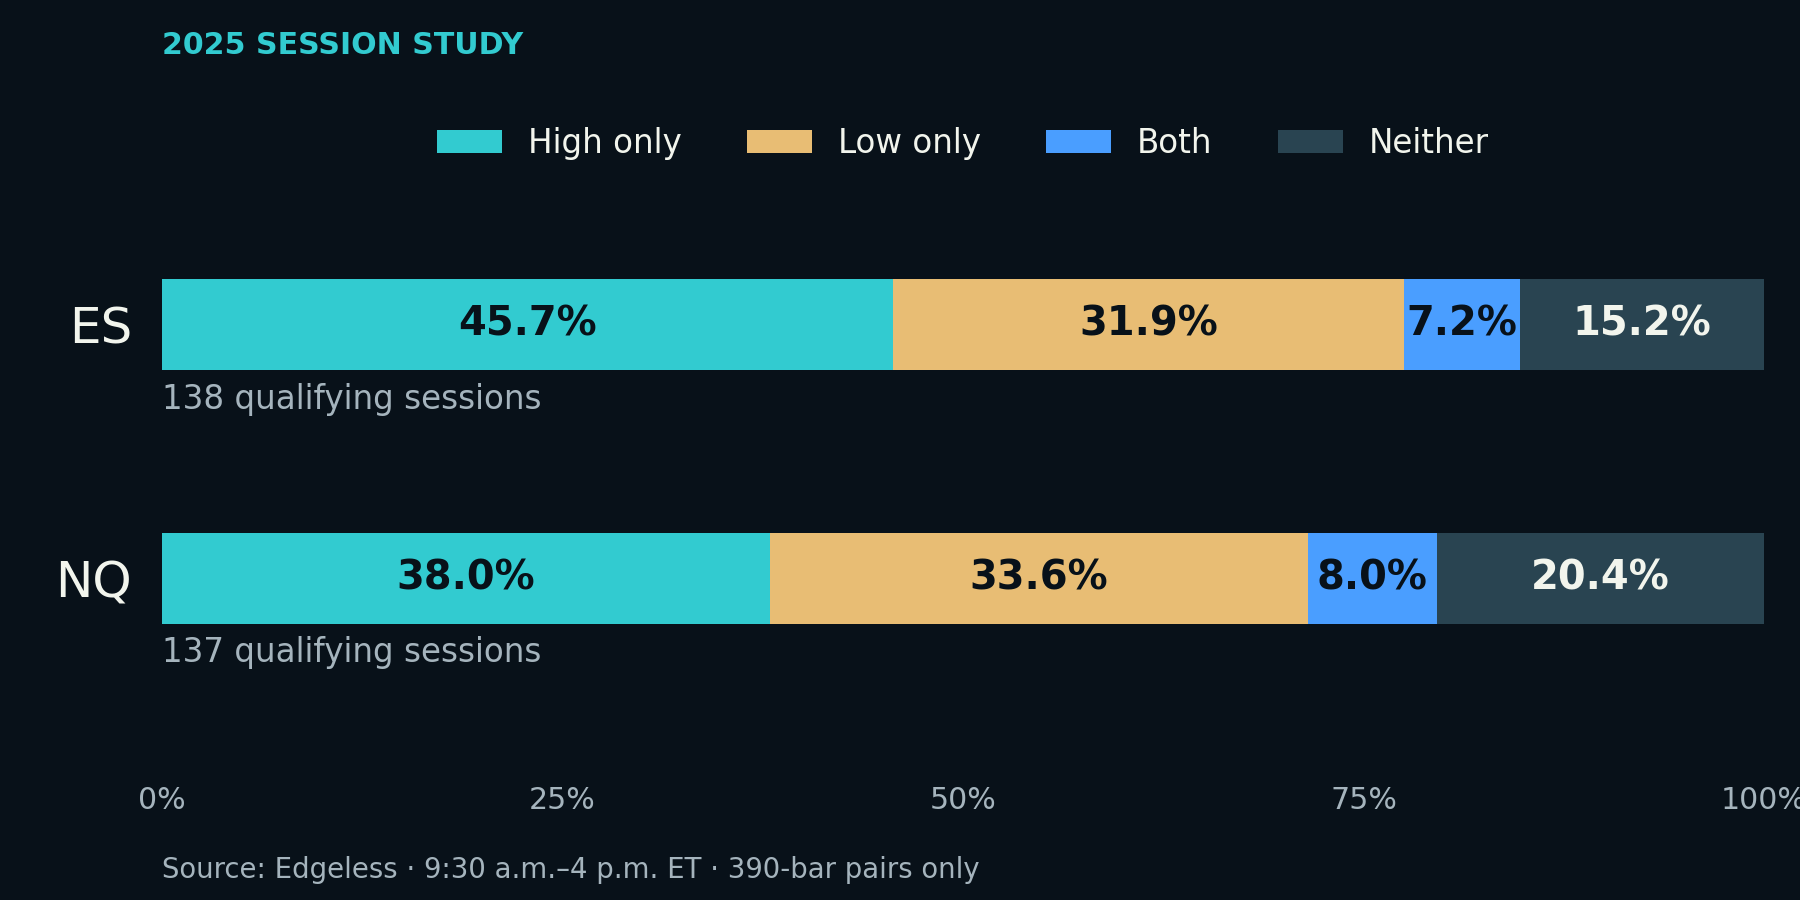
Most of these sessions reached the prior high or low
ES opened inside the prior stored range in 138 qualifying sessions. It reached at least 1 boundary in 117 of them. NQ had 137 inside opens and reached a boundary in 109. The sessions that stayed clear of both edges were the smaller group: 21 on ES and 28 on NQ.
| Market | Inside opens | High only | Low only | Both | Neither |
|---|---|---|---|---|---|
| ES | 138 | 63 (45.7%) | 44 (31.9%) | 10 (7.2%) | 21 (15.2%) |
| NQ | 137 | 52 (38.0%) | 46 (33.6%) | 11 (8.0%) | 28 (20.4%) |
We split the results into 4 groups so you can see what went into the headline. On ES, 63 sessions reached only the prior high, 44 reached only the low, and 10 reached both. NQ had 52 high-only sessions, 46 low-only sessions and 11 that reached both.
The high-only group is larger in both markets. We wouldn’t take a long bias from that alone. We haven’t separated these sessions by trend, volatility, event days or where the open sat within the range. An open near the high and an open near the low both qualify here.
What interests us is the prior range as a reference after an inside open. You have a high and a low you can watch. This sample tells you how often price reached them, but you still have to see what price does when it gets there.
We’re checking the open, then following the session
An inside open means the session starts between the previous stored low and high. Either endpoint qualifies. We don’t require the rest of the session to stay inside. That would answer a different question.
Edgeless calls this report inside_bar. We’re calling it an inside-open study because the code checks where the session starts. If you read “inside bar” as an entire day contained within the prior day, you’d be reading a different condition into these results.
A high touch counts when the current high reaches or exceeds the prior high. A low touch counts when the current low reaches or falls below the prior low. An open exactly on a boundary counts as an immediate touch. That means some touches require no additional movement from the open.
The 4 groups are separate. A session that reaches both sides goes in “Both,” leaving the high-only and low-only groups untouched. You can add all 4 columns to get the sample size without counting a session twice.
How we built the sample
We used Edgeless, our session research engine, with the stored ES.F and NQ.F profiles for 2025. The study window is January 1 through December 31. The available rows start January 2. The last stored session from 2024 provides the first prior-session comparison.
The hours matter here. We measured 9:30 a.m. to 4 p.m. Eastern, using America/New_York for daylight saving time. The 4 p.m. bar is excluded. If your chart includes the overnight session, you’re looking at a different range.
Both sessions in a pair need exactly 390 one-minute bars. That leaves 237 eligible pairs out of 249 stored sessions for each market. The 12 excluded pairs include short or incomplete sessions and the comparisons that depend on them. Having 390 bars doesn’t prove every price is right. It gives this sample a consistent stored bar count.
| Market | Stored 2025 sessions | Eligible pairs | Excluded pairs |
|---|---|---|---|
| ES | 249 | 237 | 12 |
| NQ | 249 | 237 | 12 |
We kept the original session pairs. Removing a short session doesn’t let the next day reach back to some other close. “Previous” means the previous stored session throughout this paper. Exchange-calendar completeness and contract-roll handling haven’t been independently certified. The profiles use calculation version edgeless-session-profile-v1.
Each eligible pair went through the Edgeless report separately. Its result was also checked directly against the price boundaries before the counts were added up. We used the same 2025 window and bar-count rule for both studies. There’s no search through weekday or other filters to get the biggest percentage.
A touch leaves a lot unanswered
We can’t tell you which edge was reached first from the session summary. We also can’t tell you whether a touch immediately reversed, whether a break continued, or whether you could have held a position through the move. None of those outcomes is measured by the 84.8% figure.
If you want to test a breakout or a fade, you need the path through the session and actual entry and exit rules. This paper doesn’t simulate those trades, fees or slippage. We’re not assigning a direction to tomorrow’s open from these counts.
The 390-bar rule also leaves short sessions outside the sample. Keep that in mind if you use the numbers around a holiday. Source corrections, another year or different session hours can change the result. These are futures range observations; the GEXARCADE options models weren’t tested here.
Download the numbers
The aggregate counts are free to download as a CSV. You can also open the study summary as JSON for the session definitions and exclusions. The counts are unrounded. Divide an outcome by its sample size and round to 1 decimal place to reproduce the percentages here.
My gap-fill study looks at the prior close instead. Read that alongside this one if you want both opening references defined.