
What gamma exposure tells you
Gamma describes how an option’s delta changes as the underlying price changes. Delta describes sensitivity to that price. The Options Industry Council’s gamma explanation covers that relationship and why at-the-money options near expiration can have particularly sensitive deltas.
A gamma exposure view aggregates modeled options exposure across the book. That gives you a way to compare concentrations by price. It remains a model of positioning. An open-interest snapshot does not reveal every participant’s current hedge or guarantee that a visible strike will stop the market.
Three reads, three jobs
| Model | What to look for | What the label does not mean |
|---|---|---|
| ISO | Ranked gamma concentrations within the range | ISO 1 is a rank, not the first strike price or a guaranteed support level. |
| GRID | The day’s expected-move range around the stored close | A boundary is not a hard limit on how far price can travel. |
| GLITCH | Thin net-gamma pockets between ranked strikes | A pocket does not guarantee a fast move or reveal resting orders. |
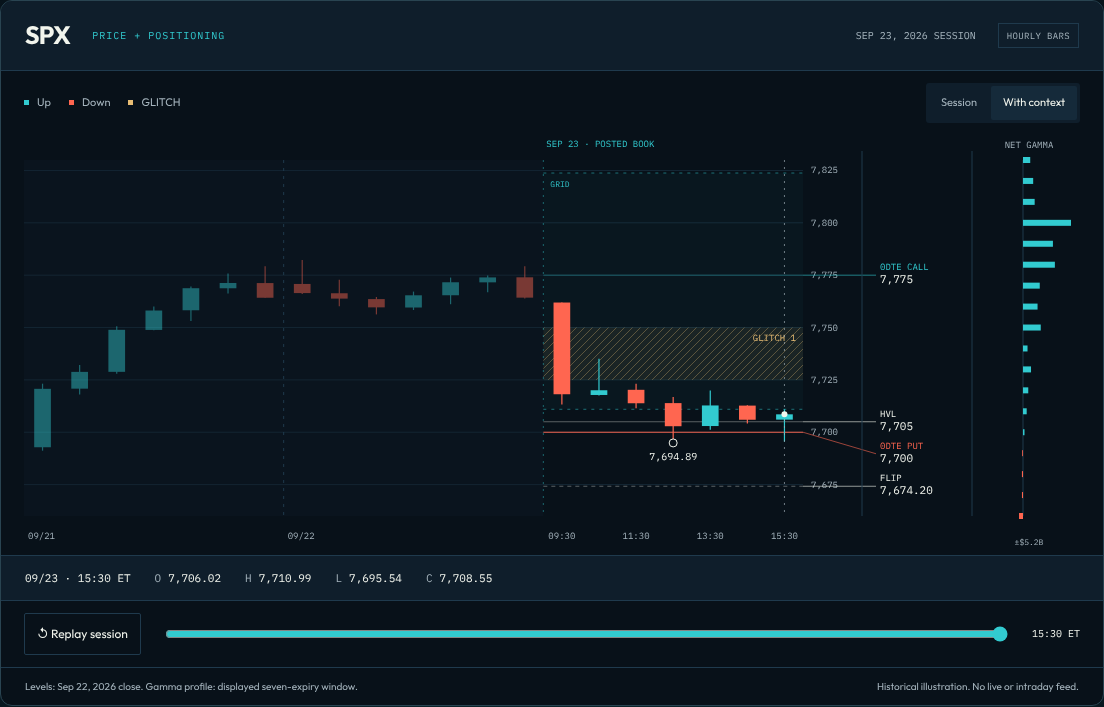
Start with the date and the range
Check the options-book date before interpreting a line. In the end-of-day beta, the book is a stored snapshot. A later candle on the screen does not turn that snapshot into a live options feed. The example above labels the two dates separately because price context and the options book serve different roles.
Next, locate price within GRID. This shows the levels against the expected range instead of leaving every strike on equal footing. If the app labels a fallback range, read it as a fallback rather than an options-implied estimate. A point near a range edge deserves different context from a point near its center, but neither location supplies a trade on its own.
A rank is not a price sequence
ISO ranks the qualifying concentrations by weight. The chart can therefore show ISO 4 above ISO 1 and ISO 3 below it. That is expected: price determines where the line sits, while the rank describes its position in the model’s ordering. A full-book view and a stored-session 0DTE view can emphasize different strikes because they examine different expiration sets.
GLITCH then calls attention to thin pockets between ranked levels. Read the pocket’s two boundaries, not just its label. It is a view of net gamma between those strikes, not a claim that the order book is empty. Options positioning and resting liquidity are different datasets.
Put another reference beside it
A prior close, prior-session high or low can sit near an options-derived level. The sources remain different. Our Edgeless gap-fill study measures returns to a prior futures close; the inside-open study measures prior-range touches. Neither study proves the options model works, and a shared location does not make the two calculations independent confirmation.
For a different read on market conditions, compare volatility premium with compression. The chart, the volatility readings and the historical studies answer separate questions. Keep their dates and definitions visible while building your session plan.