
Volatility premium compares priced movement with observed movement
Implied volatility comes from options pricing. Realized volatility summarizes movement already observed in the underlying. The Options Industry Council’s pricing guide explains that implied volatility is one of several inputs affecting option premiums. A higher estimate generally means more expected variability, in either direction.
GEXARCADE’s VOLATILITY PREMIUM view compares its 30-day implied reading with a 30-session realized reading. You can inspect the gap in volatility points and the implied-to-realized ratio. Where enough qualifying stored closes exist, the app also provides historical context. A missing input should not be treated as a zero.
Read the ratio before calling it a squeeze
In the September 22, 2026 app capture, IWM shows a 6.41-point premium and a 1.542× implied-to-realized ratio. That means the implied reading was above the realized reading used in that comparison. It does not mean a 54.2% chance of a breakout, a 54.2% price move, or a profitable options-selling opportunity.
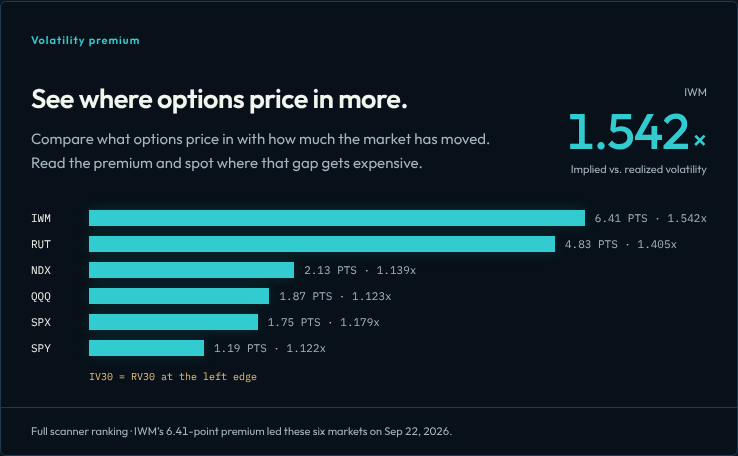
The time windows matter. A forward-looking price estimate and a trailing realized measurement do not cover identical periods. An event in the coming window, or unusually quiet movement in the trailing window, can widen their difference. The ratio gives you a comparison to investigate, not the reason for that difference.
Compression asks whether two quiet readings agree
COMPRESSION checks a small options-implied expected move alongside a quiet recent trading range. Both sides must qualify before the app labels a market compressed. That is a different question from whether implied volatility sits above realized volatility.
The captured SPX expected move is 0.726%, at the fourth percentile in the stored comparison history. That is evidence about the options side of the check. It does not, by itself, establish that the recent-range side passed. A low percentile means low relative to that recorded population; it is not a prediction that the next session must expand.
| Reading | Question it answers | Common misread |
|---|---|---|
| Volatility premium | How does options-implied volatility compare with realized volatility? | A high ratio predicts an imminent directional breakout. |
| Compression | Do the expected move and recent range both look quiet? | A low expected-move percentile alone confirms compression. |
Keep the condition separate from the outcome
Use the scanner to narrow the markets you want to inspect. Then check the date, the relevant inputs and the chart’s ISO, GRID and GLITCH levels. A stored end-of-day reading describes that book and its reference history. It does not update because the latest price candle moves.
Testing what happens after a condition is a separate research step. The Edgeless studies show that distinction by stating the condition, counting qualifying sessions and defining an outcome before presenting a rate. The gap-fill and inside-open studies do not test these volatility scanners. Neither the examples here nor those studies establish an executable strategy.