


GEXARCADE
Menu
Classic GEXARCADE arcade console with joystick, buttons and the Gamma girders market climbing game on its screen

The market, in play.

Gamma exposure & proprietary options models

Go into the session loaded.

The options book, read into levels you can put on a chart. ISO, GRID and GLITCH on the tape, squeeze scanners across six markets and a 24-tool loadout, posted from the prior close at 09:31 ET every trading day.

ISO · GRID · GLITCH · SMILE FAN

Enter LEVEL ONE $29/mo or $290/yr

Beta · End-of-day options data · FREE PLAY is $0

The chart / LEVEL ONE

The levels stay put. Price tells the story.

SPX’s posted book from the Sep 22 close, drawn over the recorded Sep 23 session. Replay the tape bar by bar and watch price work the walls, the flip and the GLITCH pocket. Every candle, level and gamma bar here is drawn in the page from stored data.

SPXPRICE + POSITIONING

SEP 23, 2026 SESSION

HOURLY BARS
UpDownGLITCH
15:30 ET
Levels: Sep 22, 2026 close. Gamma profile: displayed seven-expiry window.Historical illustration. No live or intraday feed.

The next session / Sep 23, 2026

The wall was 7,700. The low was 7,694.89.

Price traded through the prior-close 0DTE put wall. The record keeps both numbers.

Historical price comparison, not a win rate. RECENT RESULTS and the full session ledger are LEVEL ONE features.

POSTED PUT WALL
7,700.00
SESSION LOW
7,694.89
POINTS BELOW
5.11

The book / LEVEL ONE

Price has pressure points.

The level is only the start. See how much positioning sits at each strike, which side it favors and when it expires. Select a strike and read its exact call, put and net gamma.

The models / LEVEL ONE

There’s more inside the GRID.

Our house levels separate the strongest concentrations from the space between them. See the rank and the actual price together, then put the rest of the house to work.

SPX / Sep 22, 2026 close

ISO strength. GLITCH space.

HOUSE LEVELS

Share of gamma inside the GRID. Gold spans mark GLITCH 1 to 3.

ISO 1–8

Find the heavy hitters.

Our ranked gamma ladder. Up to eight of the largest concentrations inside the day’s expected range, strongest first, each at its exact strike.

GRID

Know how much room you have.

The one-day range the options book is pricing around spot. Put a level, a target or a stretched move in the same frame.

GLITCH

Spot the thin patches.

Low-gamma pockets between ranked strikes, widest first. See both boundaries and the distance price has to cross with less positioning to lean on.

SMILE FAN · Asymmetric range model

Risk doesn’t play both sides equally.

The upside and the downside carry different price tags. SMILE FAN turns that imbalance into separate upper and lower ranges over 1, 5 and 20 sessions. See how the room changes as you zoom out.

SMILE FANSPX · Sep 22, 2026 · index points
HorizonLowerUpper
1 SESSION7,708.507,822.98
5 SESSION7,626.317,887.62
20 SESSION7,433.327,998.37

Three horizons. Two sides of the move. The white tick is the Sep 22 close.

The rest of the house.

Readings depend on qualifying data. Each model ships with its method, its inputs and the gate it has to pass before it reads for members.

CROSSBOOK

Find agreement across the books.

Compare index and ETF gamma in the same futures coordinates. Each book gets an equal vote, so size alone can’t drown out the other.

CLEAR LANE

See where the book thins out.

Find stretches of light gross gamma inside the expected range. Separate sparse positioning from the crowded strikes around it.

CABINET STATE

Put the whole session in context.

Bring gamma regime, distance from the flip, front-expiry concentration and volatility premium into one market-state reading.

Squeeze / Volatility premium + compression

Put the next squeeze on your radar.

A quiet range and expensive options tell different stories. Run both checks across the market, then drill into the names worth watching.

Volatility premium

See where options price in more.

Compare what options price in with how much the market has moved. Read the premium and spot where that gap gets expensive.

IWM1.542×

Implied vs. realized volatility

Full scanner ranking · IWM’s 6.41-point premium led these six markets on Sep 22, 2026.

Compression

Put the quiet ones on your radar.

Find a small expected move paired with a quiet recent range. Both have to agree before a market qualifies as compressed.

SPX expected move0.726%

4th percentile in stored history

Sep 22, 2026. Percentile alone does not confirm compression.

Historical examples. These scanners describe conditions; they do not predict a breakout.

The loadout / 24 tools in LEVEL ONE

Follow the size. Find your setup.

Go from the biggest positions to the contracts behind them. Compare leaders, map the next session and replay the results. Every tool below ships in LEVEL ONE.

POSITIONING & EXPOSURE6 TOOLS

Find where the size is hiding.

See calls, puts and net gamma at every strike.

  • KEY STRIKES

    Find the heavyweights. See the biggest gamma concentrations and the strike carrying the largest delta exposure.

  • STRIKE HISTORY

    Watch positioning build and fade across stored closes, strike by strike.

  • EXPIRIES

    Find the expiration carrying the weight, with open interest, gamma and monthly and quarterly cycle markers.

  • CALL VS PUT NOTIONAL

    Put the call side and put side head to head with close-marked notional at every strike.

  • 0DTE ACTIVITY

    Isolate the session’s expiring contracts: cleared volume, available close-marked notional and modeled gamma.

  • WHAT TRADED

    Find where the session’s options activity concentrated, by strike and expiration.

MARKETS & MOMENTUM6 TOOLS

See who’s leading the move.

See the leaders over five stored sessions.

  • BOARD

    Size up the field. Compare each market’s distance from its gamma flip, expected-move rank and gamma exposure.

  • RELATIVE STRENGTH

    Find who’s leading and who’s lagging over 1, 5 and 20 sessions, against SPX and each market’s paired source.

  • PUT-CALL & VOLUME

    Compare put-call activity and open interest, then place the session’s volume against its stored history.

  • ACTIVITY

    Spot contracts trading above their open interest, ranked by the multiple and placed near qualified levels.

  • VS

    Compare SPX with NDX, SPY with QQQ, and their ES/NQ coordinates in expected-move units.

  • VOLATILITY CHARACTER

    Study whether daily moves tend to persist or reverse, with history-based estimates of persistence and mean reversion.

SESSION PLANNING6 TOOLS

Price the room on both sides.

See how the options-implied range changes by expiration.

  • SWING BANDS

    Give the bigger move some room. Frame 5- and 20-session expected ranges beside the record of prior daily bands.

  • IMPLIED MOVE BY EXPIRY

    See the move options are pricing into each expiration, in points and percent of spot.

  • CATALYST MAP

    Line up economic events, expirations and changes in the volatility term structure before choosing your session.

  • NEAREST EARNED

    Get straight to the closest qualified levels, measured in points, expected moves and supported futures ticks.

  • OVERNIGHT READ

    Place the dated futures observation between the translated book’s nearest levels.

  • LEVEL ALIGNMENT

    Prioritize qualified levels using eligible historical hold rates and proximity, with dated futures coordinates.

EXPIRATION PROFILES6 TOOLS

Read the size. Compare the expirations.

See call and put gamma at each strike, split by expiration, then follow the record session by session.

  • DAILY RUN

    Start with the prior-close levels and what changed. Return to the latest judged session’s scorecard.

  • TRAIL

    Follow 10 closes through each session’s own gamma flip, expected move and nearest wall.

  • ROUND RESULT

    Replay the last judged session against its frozen levels: what held, what broke and where the session closed.

  • HALL OF FAME

    Inspect the level record, misses included. Rates and rankings appear after enough judged sessions.

  • ABSORPTION

    Review five-minute ES/NQ bars at translated levels: volume, repeat touches and the session’s closing side.

  • SIGNAL LOG

    Follow recorded changes in qualified levels, gamma regimes and session verdicts across markets.

FREE PLAY / $0

Start with the levels.

An email gets you SPX and NDX gamma levels from the prior close, every trading day. No card. Read them, chart them, then open the full book when you’re ready.

Call wall & put wall

Concentrated positions that can change buying and selling around a strike. Areas to watch for resistance or support.

Gamma flip & HVL

The flip marks a change in modeled dealer gamma. HVL helps frame where price behavior may shift between a tighter range and a larger move.

One-day expected move

The range priced by the options book, in index points. Put the next session’s move in context.

FREE PLAY posts the same close LEVEL ONE does. The chart, the book, the history and the house models start in LEVEL ONE.

GEXARCADEFREE PLAY

SEP 22, 2026 CLOSE · INDEX POINTS

LEVEL ONE / Your futures points

SPX to ES. NDX to NQ.

LEVEL ONE translates the index levels into futures coordinates, ES to the point and NQ to five points, so the levels land on the chart you actually trade.

SPX → ES / GAMMA FLIP
SPX
NDX → NQ / GAMMA FLIP
NDX

Sep 22, 2026 close. Round-number estimates from a dated basis, not futures quotes.

In development

Meet the rest of the arsenal.

Our research runs from options positioning into the auction itself. BOSS FIGHT and DARK OCEAN are being built now. None of it is sold in the beta, and none of it reads for members until its data and its review gate clear.

IN DEVELOPMENT · ORDER-FLOW FEEDS NOT CONNECTED

BOSS FIGHT

Take the fight to the order book.

Follow what happens when price reaches a level: size resting, trades hitting, liquidity refilling or pulling away. BOSS FIGHT brings our order-flow indicators into one workspace.

6 planned order-flow indicators. Not available in the beta.

LEVEL AUCTION

Follow a level touch from first contact through its recorded response.

REFILL HOLD

See whether resting liquidity refills after trades consume it.

RESTING SHELF

Find displayed size that has stayed at a level long enough to count.

DEFENDER FADE

Watch resting size get canceled as price approaches.

QUEUE THRUST

Compare pressure from resting orders, additions, cancellations and trades.

LEVEL ALIGNMENT

Bring a qualified level, range, regime and order-book response together.

Requires connected order-level data and completed review. These order-flow readings are not available in the beta.

IN DEVELOPMENT · OFF-EXCHANGE FEED NOT CONNECTED

DARK OCEAN

Go beneath the displayed book.

Follow reported off-exchange activity from the large print to the price zone. Find where trading clusters, line it up with qualified levels and watch what price does next.

10 planned features for SPY, QQQ and IWM. None are built or available in the beta.

PRINT TAPE

Find the large prints. Filter by size, dollar value and time, then open the trade on the chart.

PRINT ZONES

See where reported volume piles up by price, with shares, dollar value and print counts for each zone.

REPEAT ACTIVITY

Watch zones receive more prints. See how much activity was added and when it was reported.

LEVEL OVERLAP

Put print zones beside qualified house levels. See the distance and reported size at each overlap.

PRICE RESPONSE

Follow price after a zone became visible. Inspect touches, crossings and next-session revisits.

SESSION PULSE

Compare SPY, QQQ and IWM. Track observed shares, dollar value, largest prints and busiest zones by session.

PRINT ALERTS

Get in-app notices for large prints, added zone activity and price revisits. Open the print or chart behind each alert.

SESSION REPLAY

Replay the tape, zones and levels as they became available, with delayed reports arriving when they did.

UNUSUAL ACTIVITY

Compare print size and activity with the same time in prior sessions. Requires enough comparable history.

MARKET SHARE

See observed off-exchange shares as a portion of total market volume. Requires verified consolidated volume and coverage.

Requires an off-exchange equity feed, retained history and completed review. Price tracking and market-share readings need additional data.

Our research. Free to use.

Data Decoded

Our ES and NQ session studies, with the data, methods and results laid out. Read the full papers here or download the counts. Free to use, no account needed.

Edgeless / 2025 session study

Gaps don’t always fill. Here’s what ES and NQ did in 2025.

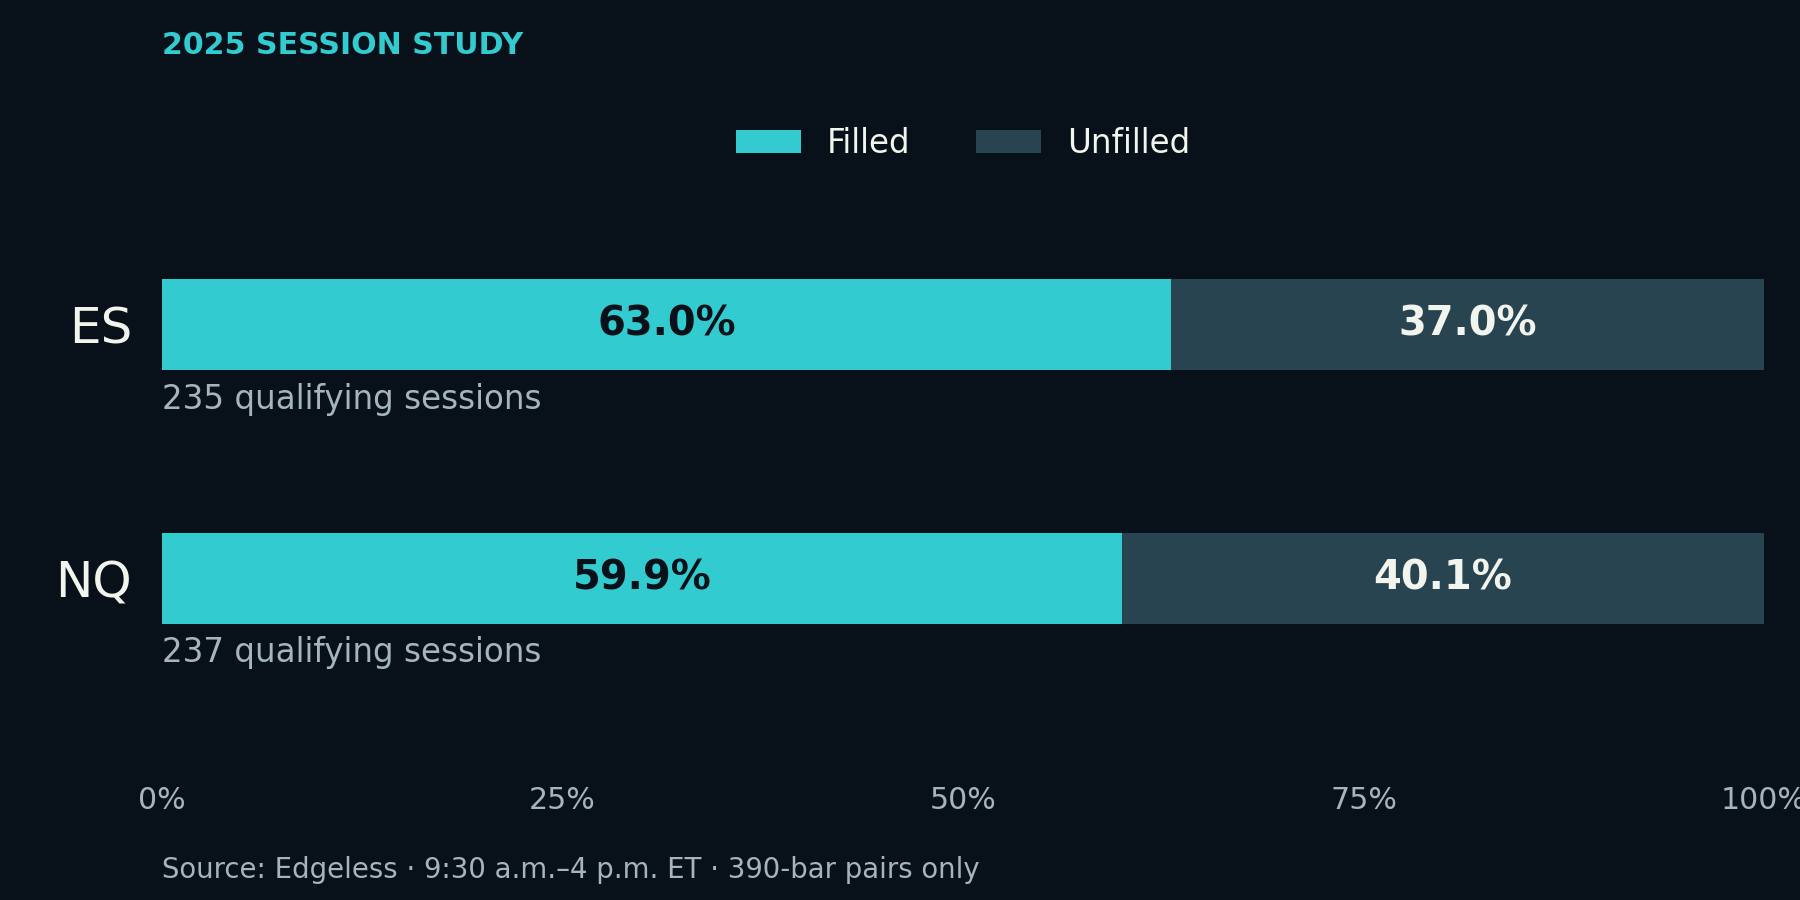
We ran the 2025 ES and NQ sessions through Edgeless to count gap fills. ES got back to the prior close 63.0% of the time. NQ did it 59.9% of the time. Before you turn either number into a reason to fade the open, look at the gaps that stayed open.

Open the article ↗
ES: 63.0% of gaps filled; NQ: 59.9%. Remaining gaps did not fill.
Edgeless · 2025 · 9:30 a.m.–4 p.m. ET
Read the full study here

87 ES gaps stayed open

ES filled 148 of 235 qualifying gaps. The other 87 never got back to the prior close during the session we measured. NQ filled 142 of 237, leaving 95 open. You can see both sides of that result below.

MarketGap sessionsFull fillUnfilledHalf fill
ES235148 (63.0%)87 (37.0%)184 (78.3%)
NQ237142 (59.9%)95 (40.1%)181 (76.4%)

We’d keep those unfilled counts next to any gap-fill percentage. If you’re staring at yesterday’s close waiting for price to come back, 87 ES sessions and 95 NQ sessions didn’t give you that return in this sample. You don’t get to know which group today belongs to at the open.

The halfway point was reached more often. ES got there in 184 sessions, or 78.3%. NQ reached it in 181, or 76.4%. Full fills are included in those halfway counts. Don’t add the columns together.

A closer target gets touched more often here. Whether you can trade that with an entry, a stop and a sensible payoff is a separate test. We haven’t run that test in this paper.

Which gap we’re measuring

We’re comparing the current session’s open with the previous stored session’s close. The difference has to be at least 0.25 points, which is 1 tick on ES and NQ. Both gap directions count. There’s no additional filter for size or weekday.

For a gap up, price has to trade down to the previous close for a full fill. For a gap down, it has to trade up to that close. Trading through the close counts too. A half fill reaches the midpoint between the open and that close.

Check those reference prices before you compare this with another gap study. An evening futures reopen, a settlement price and a 9:30 a.m. open can give you different gaps. This paper measures the last one against the prior stored cash-session close.

How we built the sample

We used Edgeless, our session research engine, with the stored ES.F and NQ.F profiles for 2025. The study window is January 1 through December 31. The available rows start January 2. The last stored session from 2024 provides the first prior-session comparison.

The hours matter here. We measured 9:30 a.m. to 4 p.m. Eastern, using America/New_York for daylight saving time. The 4 p.m. bar is excluded. If your chart includes the overnight session, you’re looking at a different range.

Both sessions in a pair need exactly 390 one-minute bars. That leaves 237 eligible pairs out of 249 stored sessions for each market. The 12 excluded pairs include short or incomplete sessions and the comparisons that depend on them. Having 390 bars doesn’t prove every price is right. It gives this sample a consistent stored bar count.

MarketStored 2025 sessionsEligible pairsExcluded pairs
ES24923712
NQ24923712

We kept the original session pairs. Removing a short session doesn’t let the next day reach back to some other close. “Previous” means the previous stored session throughout this paper. Exchange-calendar completeness and contract-roll handling haven’t been independently certified. The profiles use calculation version edgeless-session-profile-v1.

Each eligible pair went through the Edgeless report separately. Its result was also checked directly against the price boundaries before the counts were added up. We used the same 2025 window and bar-count rule for both studies. There’s no search through weekday or other filters to get the biggest percentage.

What we still don’t know from these counts

A session’s open, high, low and close can tell us whether price reached the prior close. They can’t tell us how painful the trip was. You could get a fill after price first moves a long way against a position. The fill still counts here.

We can’t recover time to fill or the order of touches from those 4 prices either. There’s no simulated entry, stop or exit. Fees and slippage aren’t modeled. Calling 63.0% a trade win rate would give the count a meaning it doesn’t have.

We’re looking at 1 year of futures sessions. A different year or session definition can change the result. ISO, GRID and GLITCH aren’t inputs to this study, so these counts don’t validate those options models. If you put a gamma level beside the prior close, keep track of where each reference came from.

Download the numbers

The aggregate counts are free to download as a CSV. You can also open the study summary as JSON for the session definitions and exclusions. The counts are unrounded. Divide an outcome by its sample size and round to 1 decimal place to reproduce the percentages here.

You can read our inside-open study next. It follows the prior high and low after price opens within that range.

Edgeless / 2025 session study

ES opened inside the range. It still reached an edge 84.8% of the time.

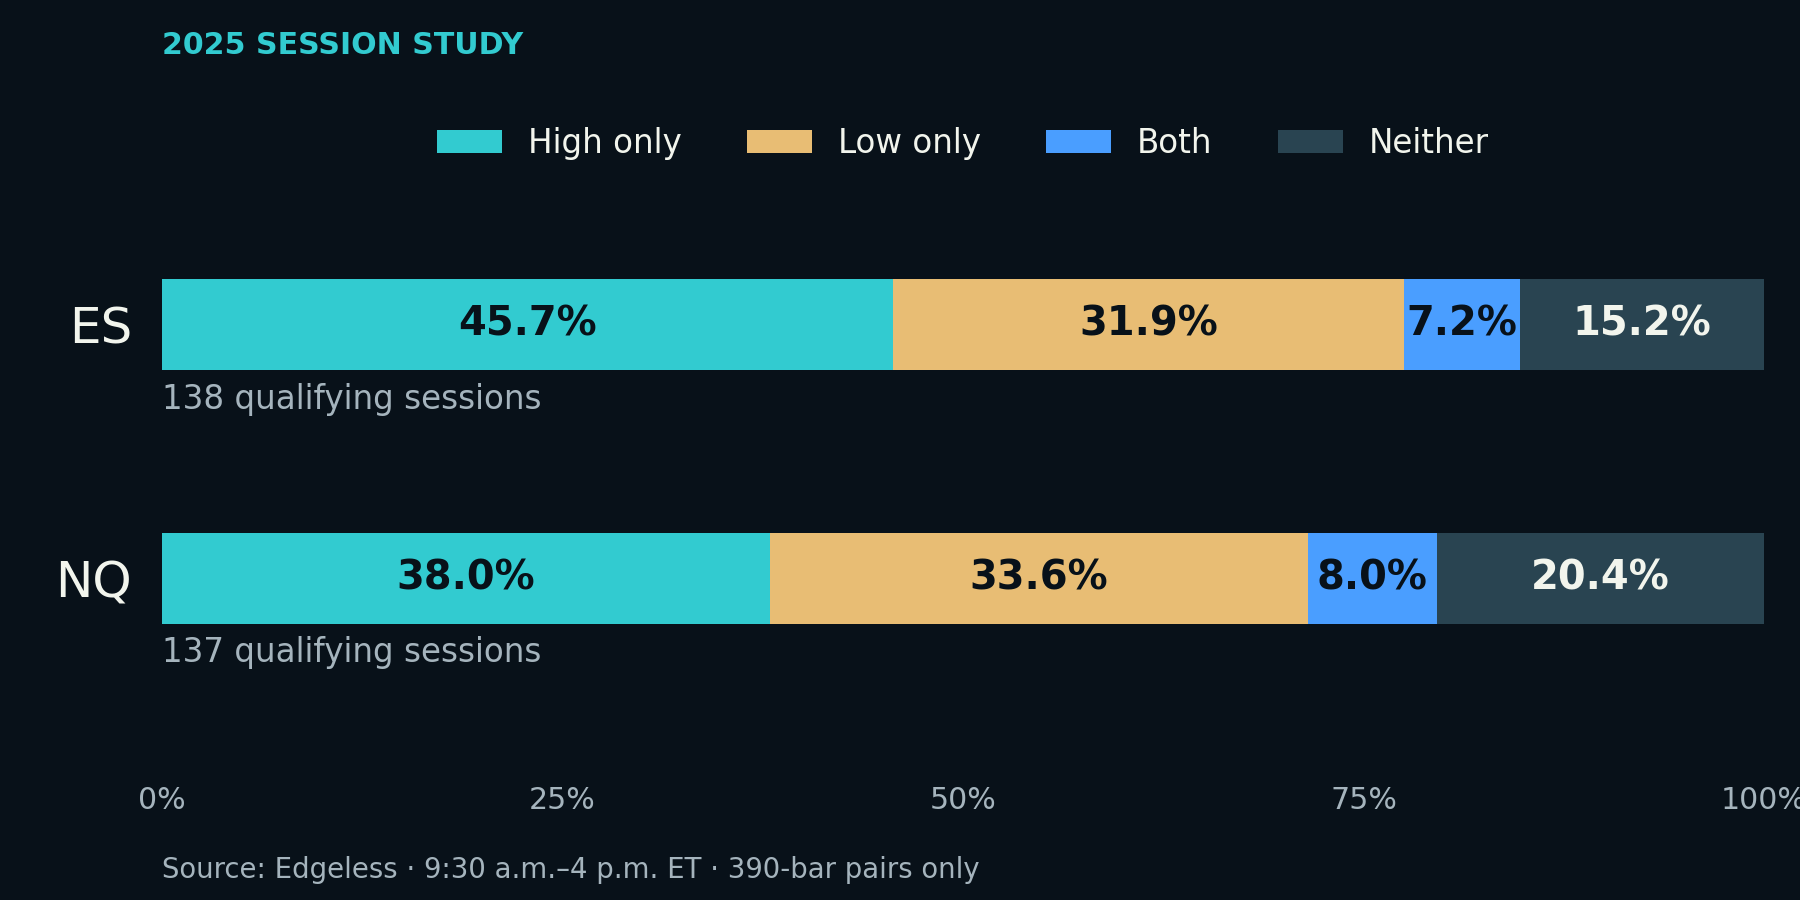
We wanted to check what happened after ES and NQ opened inside the previous session’s range. In the 2025 sample, ES reached at least one edge 84.8% of the time. NQ did it 79.6% of the time. You still don’t know which side goes first.

Open the article ↗
2025 inside opens: ES high only 45.7%, low only 31.9%, both 7.2%, neither 15.2%; NQ 38.0%, 33.6%, 8.0%, 20.4%.
Edgeless · 2025 · 9:30 a.m.–4 p.m. ET
Read the full study here

Most of these sessions reached the prior high or low

ES opened inside the prior stored range in 138 qualifying sessions. It reached at least 1 boundary in 117 of them. NQ had 137 inside opens and reached a boundary in 109. The sessions that stayed clear of both edges were the smaller group: 21 on ES and 28 on NQ.

MarketInside opensHigh onlyLow onlyBothNeither
ES13863 (45.7%)44 (31.9%)10 (7.2%)21 (15.2%)
NQ13752 (38.0%)46 (33.6%)11 (8.0%)28 (20.4%)

We split the results into 4 groups so you can see what went into the headline. On ES, 63 sessions reached only the prior high, 44 reached only the low, and 10 reached both. NQ had 52 high-only sessions, 46 low-only sessions and 11 that reached both.

The high-only group is larger in both markets. We wouldn’t take a long bias from that alone. We haven’t separated these sessions by trend, volatility, event days or where the open sat within the range. An open near the high and an open near the low both qualify here.

What interests us is the prior range as a reference after an inside open. You have a high and a low you can watch. This sample tells you how often price reached them, but you still have to see what price does when it gets there.

We’re checking the open, then following the session

An inside open means the session starts between the previous stored low and high. Either endpoint qualifies. We don’t require the rest of the session to stay inside. That would answer a different question.

Edgeless calls this report inside_bar. We’re calling it an inside-open study because the code checks where the session starts. If you read “inside bar” as an entire day contained within the prior day, you’d be reading a different condition into these results.

A high touch counts when the current high reaches or exceeds the prior high. A low touch counts when the current low reaches or falls below the prior low. An open exactly on a boundary counts as an immediate touch. That means some touches require no additional movement from the open.

The 4 groups are separate. A session that reaches both sides goes in “Both,” leaving the high-only and low-only groups untouched. You can add all 4 columns to get the sample size without counting a session twice.

How we built the sample

We used Edgeless, our session research engine, with the stored ES.F and NQ.F profiles for 2025. The study window is January 1 through December 31. The available rows start January 2. The last stored session from 2024 provides the first prior-session comparison.

The hours matter here. We measured 9:30 a.m. to 4 p.m. Eastern, using America/New_York for daylight saving time. The 4 p.m. bar is excluded. If your chart includes the overnight session, you’re looking at a different range.

Both sessions in a pair need exactly 390 one-minute bars. That leaves 237 eligible pairs out of 249 stored sessions for each market. The 12 excluded pairs include short or incomplete sessions and the comparisons that depend on them. Having 390 bars doesn’t prove every price is right. It gives this sample a consistent stored bar count.

MarketStored 2025 sessionsEligible pairsExcluded pairs
ES24923712
NQ24923712

We kept the original session pairs. Removing a short session doesn’t let the next day reach back to some other close. “Previous” means the previous stored session throughout this paper. Exchange-calendar completeness and contract-roll handling haven’t been independently certified. The profiles use calculation version edgeless-session-profile-v1.

Each eligible pair went through the Edgeless report separately. Its result was also checked directly against the price boundaries before the counts were added up. We used the same 2025 window and bar-count rule for both studies. There’s no search through weekday or other filters to get the biggest percentage.

A touch leaves a lot unanswered

We can’t tell you which edge was reached first from the session summary. We also can’t tell you whether a touch immediately reversed, whether a break continued, or whether you could have held a position through the move. None of those outcomes is measured by the 84.8% figure.

If you want to test a breakout or a fade, you need the path through the session and actual entry and exit rules. This paper doesn’t simulate those trades, fees or slippage. We’re not assigning a direction to tomorrow’s open from these counts.

The 390-bar rule also leaves short sessions outside the sample. Keep that in mind if you use the numbers around a holiday. Source corrections, another year or different session hours can change the result. These are futures range observations; the GEXARCADE options models weren’t tested here.

Download the numbers

The aggregate counts are free to download as a CSV. You can also open the study summary as JSON for the session definitions and exclusions. The counts are unrounded. Divide an outcome by its sample size and round to 1 decimal place to reproduce the percentages here.

My gap-fill study looks at the prior close instead. Read that alongside this one if you want both opening references defined.

GEXARCADE LEVEL ONESPX · THE CHART
ISO · GRID · GLITCH

Built for your setup

Your desk.
Your phone.
Your rules.

Take the house models wherever you plan your session. Choose ARCADE or NORMAL, keep your saved views and export levels to your own charts.

Desktop & mobileARCADE & NORMALLevel exports
Get the full loadout

Drawn from the Sep 22, 2026 book and the recorded Sep 21 to 23 session bars.

LEVEL ONE

Your whole session.
One $29 loadout.

ISO, GRID, GLITCH and SMILE FAN on the chart, the full book, the volatility and compression scanners, 24 positioning and planning tools, and the session record. A full research routine behind your next move.

Beta. Full end-of-day analytics.

LEVEL ONEThe full loadout
$29/month

or $290/year Save $58 a year

  • 7 proprietary model profiles
  • Volatility and compression scanners
  • 24 positioning, planning and replay tools
  • Historical sessions and level exports
  • Desktop, mobile, ARCADE and NORMAL
Enter LEVEL ONE

Beta · Model readings need qualifying data

LEVEL TWO

Planned · $59/mo

Intraday analytics. Not available in this beta.

BOSS FIGHT

Planned · about $99/mo

A future order-flow tier. Scope and price are not final.

Is Data Decoded free to use?

Yes. The full Edgeless studies, methods and aggregate downloads are free. Read them on this page or in the research library without an account. They’re included with FREE PLAY and don’t require LEVEL ONE.

When is the data updated?

The beta uses end-of-day options data. Each view names its data date. It does not include a live options feed or live order flow.

Can I use the levels with my own charts?

LEVEL ONE includes level exports. Futures coordinates use a dated translation from the options book. Bring your own charting platform and market-data subscription.

Do the models tell me what to trade?

The models describe positioning, ranges and market conditions. They do not guarantee direction or an outcome. You decide the trade and the risk.

How do I join the beta?

Create an account at app.gexarcade.com. FREE PLAY needs an email. The LEVEL ONE button opens the app’s signup page. The prices above describe the plans; this page does not collect a payment.

Your next session

Go in with your levels.

Enter LEVEL ONE